Since the start of lockdown, I’ve found ever more reasons to be grateful for the surprisingly sunny postage-stamp of a garden I enjoy here in London. I am however moving to a new house soon, and have been curious to know how the new garden will fare in comparison. Hopefully so are you, as we’re about to enjoy it in painful detail.
The app
This post is more interactive than most – you can recreate all of the calculations below with a handy app I whipped up for the occasion (doesn’t really work on mobile):
Interactive solar irradiance app
For some inspiration, you can see the layout I used in this post here – click and drag and scroll to pan and zoom around:
The problem
I wanted to know (as I sat in the garden clutching a beer and watching the shadows creep along the ground) how much light different parts of the garden receive over the day.
Specifically, you might want to know different metrics for different purposes, e.g.
- For plants: what is the average solar flux received over the year?
- For planning barbecues: how long will the sun be up on a particular day?
- For placing furniture: what proportion of the time will the sun be shining in a particular place?
To answer these questions, we’ll first need to know where the sun is at any given point in time.
The sun
Consider a point on the Earth at some latitude 
Because the rotation axis of the Earth is not perpendicular to the plane of the orbit around the sun, the apparent angle of the incoming solar rays changes depending on the time of year:
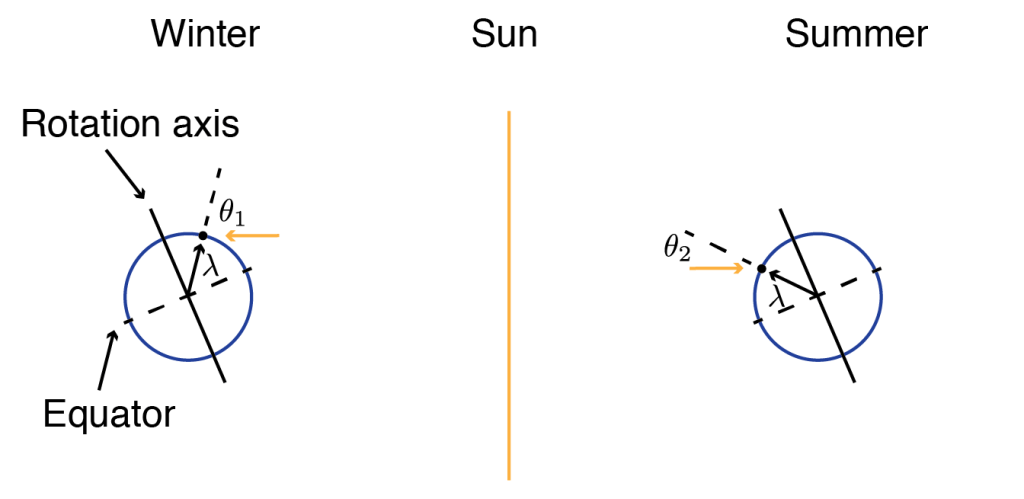
In winter, at midday the incoming solar radiation arrives at an angle 

To see why this makes a difference, consider the diagram below. Solar rays arrive at an angle 


From some trig we know that 


The position of the sun
Now we know how the power received by the sun changes as a function of the position of the sun, we just need to know the sun’s position. In practise if you care about the apparent sun position with any accuracy this can be a horribly complicated problem, given time zones, leap years, leap seconds etc.
Fortunately we don’t care about accuracy here, and so I just took the approximate formulae from the NOAA here. You can plot the results of these relatively simple equations, and they look sensible:
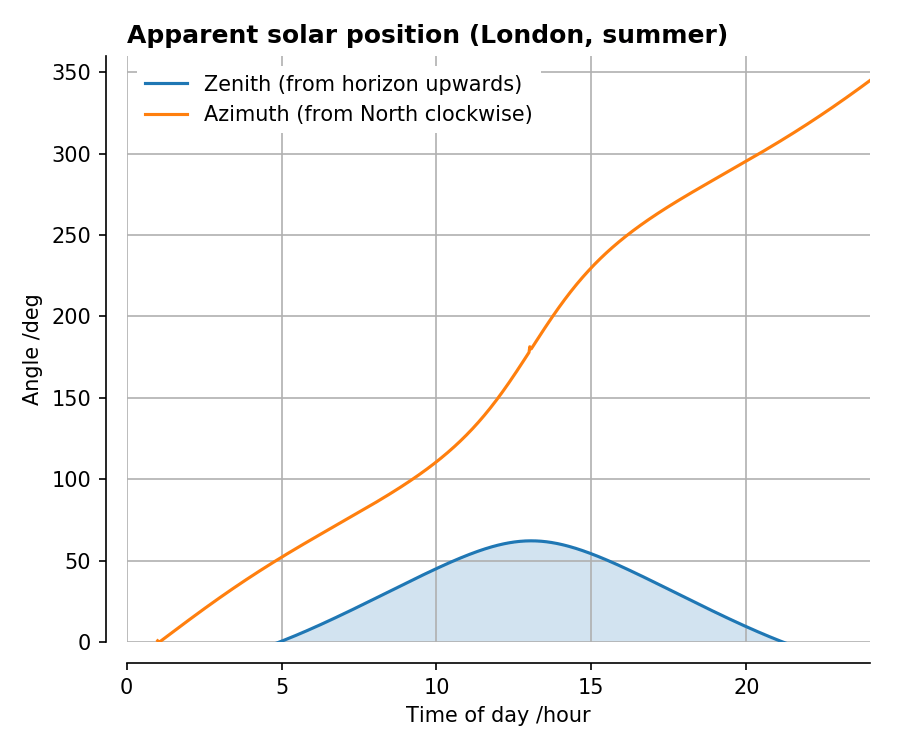
The above plot shows the solar position for London during the summer solstice – it rises around 5AM and sets around 9PM, reaching a maximum height (zenith) of around 60 degrees. At noon the sun is due south (at an angle of 180 degrees) and swings from East to West throughout the day.
Casting shadows
The final piece in this puzzle is to work out which parts of the ground receive no solar power at all – which parts are in shadow.
Consider the diagram below:
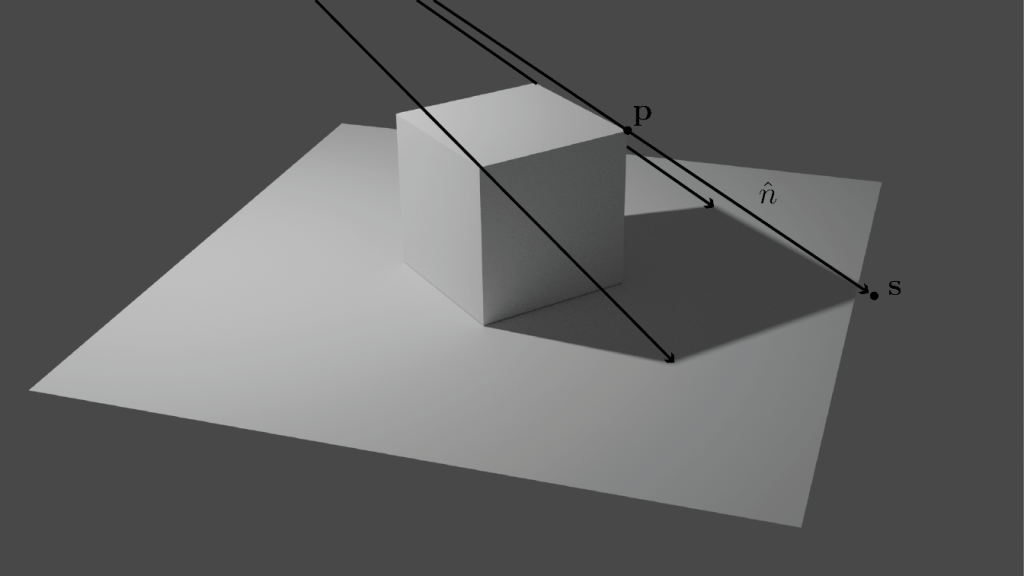
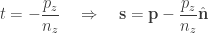
Rays are arriving with some direction 


for some value of 

The answers
Right, let’s crack on. Using the app I mentioned above, the shadows projected by a square block (in London, at the summer solstice) vary throughout the day as follows:
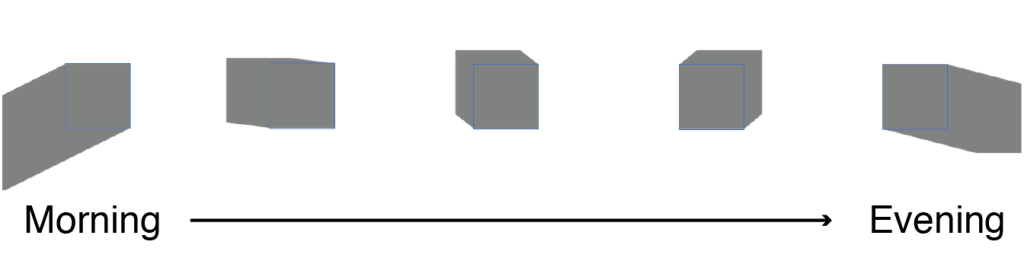
i.e. in the morning the sun appears from the north-east, and by the evening is in the north-west. At noon, where the sun is strongest (due to the
Now it gets interesting when we average the total solar power out over the day:
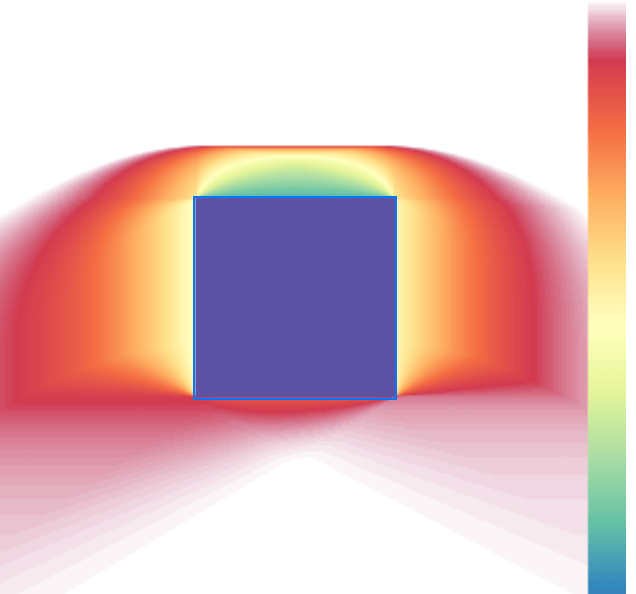
or the total time spent receiving some sunlight:
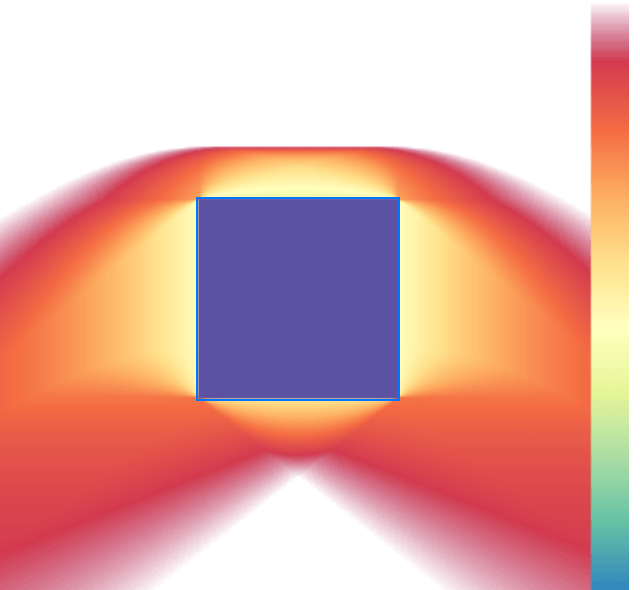
While the block casts a shadow at some point over much of the ground nearby (bottom), during the peak of the day around noon the shadow is minimised, and so the map weighted by irradiance (top) is less widely spread.
We can also average the solar flux over the entire year:
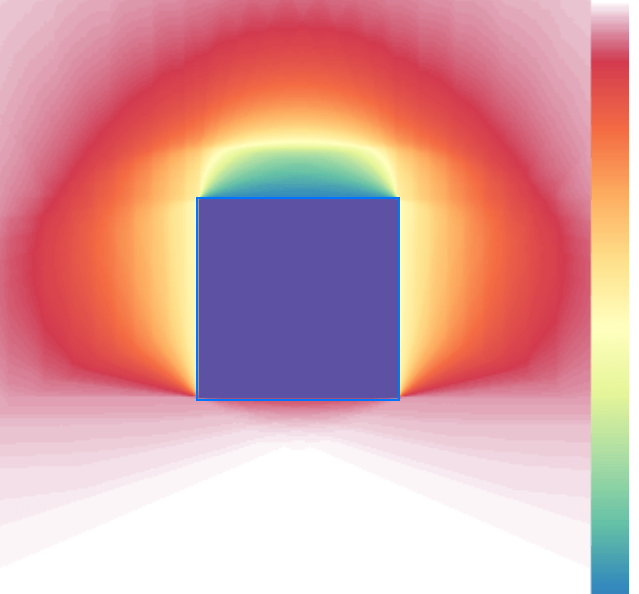
Here the fact that London is quite far north is more evident – most of the land north of the block is quite sunlight-starved, as is a surprising amount east and west.
To finally answer my question then, here’s a simulation of my current garden, averaged over the entire year:
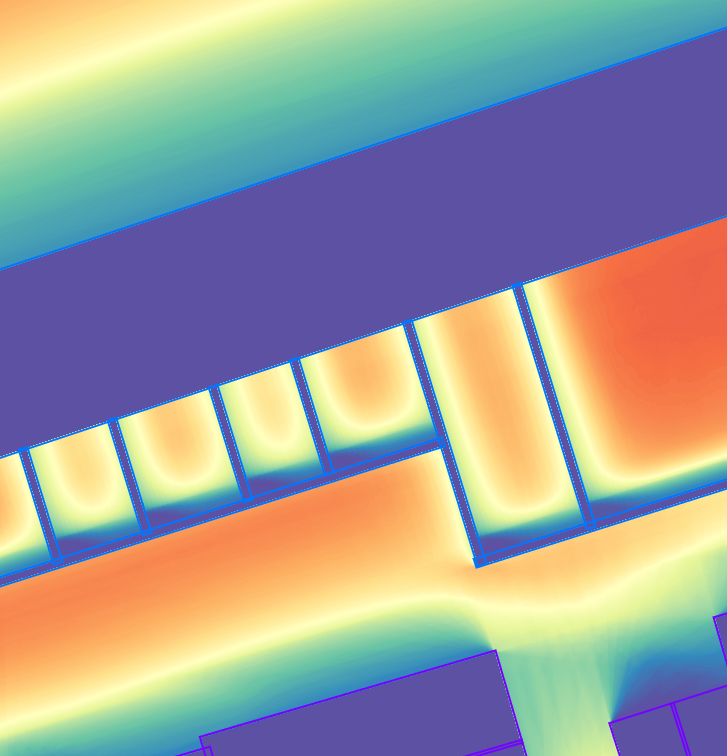
As the garden faces south, there’s actually quite a lot of sun! Which certainly makes up for the small size and overwhelming density of dandelions.
In comparison, the new garden:

Actually … not too shabby. Certainly better than I had expected, which just goes to show the importance of exhaustively satisfying any random thought which flies into your head (especially if it involves bashing out some sub-standard React).
Speaking of,
The app (again)
The simulator is a React app written in Typescript, and all calculations are performed locally in the browser. You can see the source here:
https://github.com/jasmcole/Blog/tree/master/shady-business
The code is a bit ropy, but it’s a weekend project and it works which I’ll take any day over being pristine.
To use it offline, just download the single bundled file:
The shadows are calculated by hand, and plotted using the 2D canvas API. The colourmaps are again created by hand by repeatedly copying the raw uint8 data from the canvas and accumulating it into a float64 buffer, which is then mapped to a discrete colourmap copied from Matplotlib.
While editing the positions of objects in the simulator, the URL is updated with a base64-encoded JSON string representing the object positions. You can therefore share a simulation by sharing the URL – please comment if you have a good one!
TODO
- For far better performance the app should be re-written to use WebGL, but already it is pretty quick for small numbers (~10s) of objects.
- It would be nice if it supported mobile in any way at all
