If you’re anything like me, the excruciating boredom of a trip to the supermarket is enough to get you thinking about anything else, in a desperate attempt to avoid a conversation on the best value lettuce on offer. I’ll do you a favour then by presenting some brain-fodder suitable for the next grocery hell-ride.
Supermarkets are, plainly, big business, and the companies running them take great pains to ensure their expensive buildings are utilised as effectively as possible (see, e.g., this oddly single-use blog). Though in general this is a complex problem, let’s have a look at a simple example of such analysis.
Lets set up a model of a shop, with an entrance and exit on one side with shelves and aisles running perpendicularly away. Allow for a number of gaps between the aisles, which help shoppers get around the shop.
To begin with, insert a shopper at the entrance, assign them an item to walk to, and then direct them to the exit. The shopper should walk as directly as possible towards their next goal, though we all know that in reality this is rarely the case. Unfortunately computer science has yet to catch up with the warped social dynamics at play here.
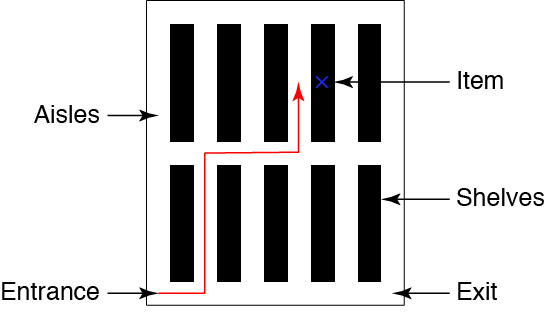
The algorithm I use for this is the A* search algorithm, a simple pathfinding algorithm widely used in computer games, for example. Being far too busy (lazy) to write my own implementation, I borrow once again from the File Exchange to save some time. I’m only interested in representing the supermarket as superficially as possible, so here I assume all aisles and walkways are one dimensional. With this assumption the supermarket is represented as a small 2D grid, and plotted below are the paths calculated by the A* algorithm for a few randomly-placed items.

These look about right, so we can be satisfied the algorithm is probably doing its job correctly. As the shopper is confined to a rigid system of aisles and walkways the distance they travel is actually controlled by the Manhattan Metric, rather than the usual 2D Euclidean metric.
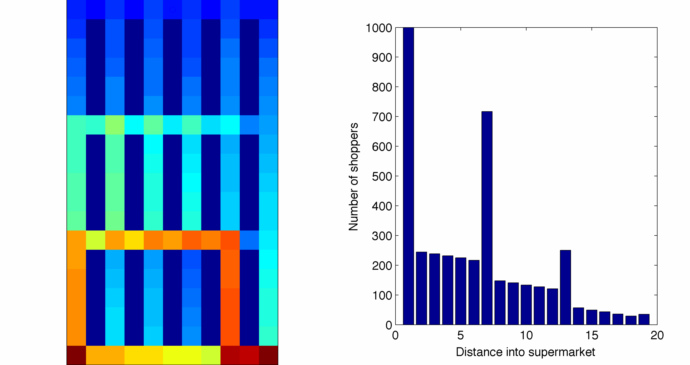
Now we’d like to see where people tend to walk, so lets inject 1000 shoppers who enter the shop, walk to a single item, then wander out again. The item is randomly distributed throughout the supermarket – this isn’t that realistic, but is an illustrative example. Plotted below is an animation showing the accumulation of the first 127 paths so generated, with small circles marking the position of the item.

What is immediately clear is how important the middle walkway is, an optimum path relies on being able to walk between aisles this way. Supermarket managers are well aware of this fact, as my formative years spent at Sainsburys stacking the promotional ‘plinth’ shelves attest to. We can sum this distribution horizontally to see how far shoppers penetrate into the store. Sorry for the bar chart, I know I’ve spoken before about my irrational hatred of them.

All shoppers visit the entrance and exit, so the number of shoppers making it to layer ‘1’ is 1000. This drops off towards the central walkway, until it suddenly spikes to over 50% of shoppers. The poor aisles farther on barely get a look in, so any self-respecting store manager would surely want to encourage customers farther into the supermarket. Well customers love a walkway, how about another?
Adding a second row of aisles doesn’t cause customers to venture farther into the shop, and there is still a significant drop-off in footfall after each walkway. What this shop needs is something to pull customers to the back and more evenly distribute footfall. To explore this situation, I’ll make things slightly more realistic by giving each customer 5 items to head for rather than 1. I didn’t go full travelling salesman on every customer, but they do at least visit the items in order from left to right to help alleviate any backtracking. I also force a varying percentage of items to be right on the back wall, simulating the location of a critical element of the supermarket (e.g. a bakery) that lots of people will visit every time they shop.
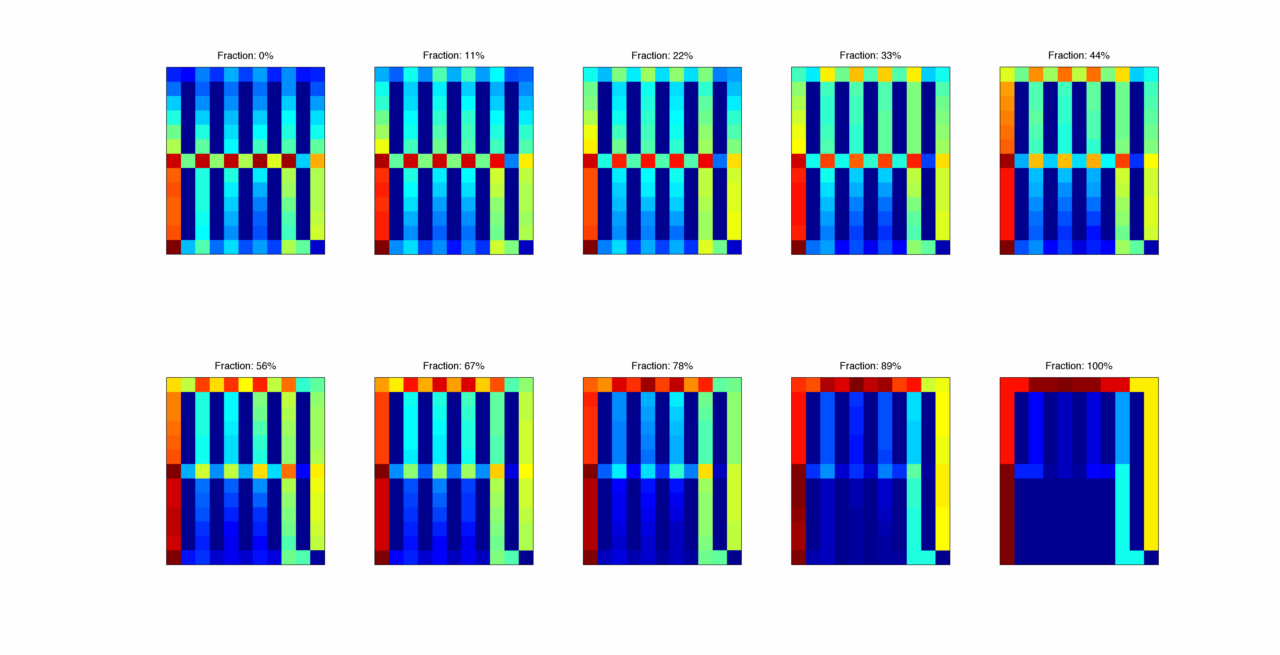
Obviously if everything was on the back wall, people just walk in straight to the back and then head out again. For a small proportion, around 10-20% it seems, total customer distribution is evened out somewhat between the front and back of the supermarket.
Next time you’re shopping then and you notice the all-important hard spirits section has been hidden away at the back, you can feel smugly superior about uncovering the hidden tactics of the crafty manager store while you buy your Tuesday afternoon vodka.

Liquids are one of the few exceptions to sales-oriented merchandizing optimization: their bulk and heft compels to place them near the warehouse, which is usually back left.
Articles placed at the back to pull shoppers into the aisles are bakery (which you mentioned), dairies and meats.
Your findings about the entrance lane are correct – that is where high margin items with likely impulse purchase are pushed to the unsuspecting shopper.
Also, your graphics nicely illustrate how the aisle ends in the perpendicular circulation aisle are hot spots for pushing stuff.
Your left entrance/right exit plan is opposite to the classical floor plan where shopper circulation runs counterclockwise.
LikeLike
Thanks for the comments. As you obviously seem to know about this area, do you know which models are used for optimising a store layout? Are customers directly simulated walking around the shop? And what’s the reasoning behind letting shoppers go anti-clockwise? Cheers.
LikeLike
Not sure about the way it’s modeled by the smartest retailers, but I do know that the consensus in the US is that moving to the right when we walk in the store is where our natural instincts want us to go. You might
like this article if you haven’t seen it before.
http://www.cracked.com/article_18805_5-ways-stores-use-science-to-trick-you-into-buying-crap.html
I come from the urban real estate development world and I can tell you that as a whole our industry is clueless about this kind of modeling and analysis (seems like our tenants – the Whole Foods, Targets, Walmarts, etc of the world are light years ahead of us)..
Would love to know where the analysis leads if looked at from a higher level about where anchor stores vs other types of stores should optimally be placed when looking at large urban projects and trying to create a merchandising plan. Like should the Grocery store be in the back where you have to walk / drive past all the smaller stores to get there or, how many anchors do you really need to ensure people are most likely to see your other smaller tenants, etc…
It becomes even more interesting when you add in complexities of different rents you can charge big anchor stores (much lower rent) compared to banks (often really high rent) or CVS / Walgreens types (often really high rents) vs local restaurants and shops (usually in between Bank rates and Anchor tenant rates but often too high for these stores to survive for long).
LikeLike