Over the last few years I’ve been working towards a PhD in the realm of experimental physics. This, naturally, requires experiments to occur. As good scientists we (ideally) record all the details of the experiments, which makes for a tasty dataset after a few years. Let’s have a look at some details.
History
I work in the field of “laser wakefield acceleration“, and as indicated by the name of the topic, our experiments necessarily include big lasers. We shoot these lasers into small pockets of gas, usually helium, and measure what comes out. What we’d like to see, as predicted in the 1970s, are high-energy electron beams with a narrow energy spread. Much work was done towards this goal over the previous few decades before it all came together in 2004, with heavy involvement by the research group at Imperial College (where I work).
These experiments excited the scientific community, and in a rare moment of rationality the UK government funded the building of a bigger, badder laser, which is really what any scientist (or evil genius) wants to hear. By the time I started my PhD the Gemini system was up and running (consisting of two beams), and is where I have spent the majority of my experimental time.
Experiments
As I said, during these experiments we fire a laser shot and take many simultaneous pictures to figure out what just happened. Then we change something and try again. And again, and again…
For each shot we record details about it – time, date, laser energy, general comments etc. in a half-automated, half-manual fashion. I look at 5 separate experiments here, lasting a total of 23 weeks and consisting of 13,000 individual laser shots.
Shot times
Plotted below is a histogram of the times of recorded laser shots over the 23 weeks of experimental time.

This is obviously a sum over all experimental days – some days we work earlier, some later, we certainly don’t stay in the laboratory from 9am until 6am every day! However the overall pattern is a familiar one. Typically during the day we are trying to install or improve the experimental setup – re-aligning optical imaging systems, fixing electrical issues, adding diagnostic equipment etc. We always aim to start taking laser shots in the afternoon while the facility support staff are still around, though it’s easy to tell here that’s not often achieved! By around 6pm the number of laser shots starts to peak until around 1am, when most people need to get to sleep if they’re to start the next day by 9/10am. There is an obvious dip around 8pm, when the on-site canteen is shutting and we all rush to eat dinner. There is a less obvious dip around 11pm, this is perhaps a characteristic time of the night where we pause to take stock and think a little more carefully about what we should ‘shoot’ next. In crunch times near the end of an experiment we may split into early and late shifts – the late shifts can end up staying until the early hours of the morning, though this isn’t that frequent.
I also plot a histogram below of the time intervals between shots. The dotted lines are placed at multiples of 40 seconds, which is the laser repetition rate.
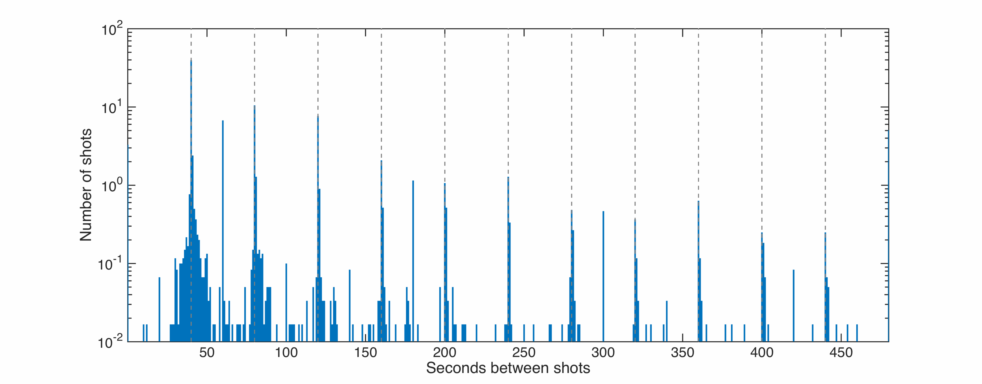
The big initial peak means that most shots are 40 seconds apart, i.e. we are using as many laser shots as possible to take data. If we ‘miss’ the next shot, the laser will fire at the next allotted shot time, giving rise to to separated peaks.
Laser energy
The laser system records some measure of the laser energy on every shot. This isn’t the actual energy of the laser pulse, though it is proportional to it. This is a data point I have for every experiment, each of which is plotted separately below.
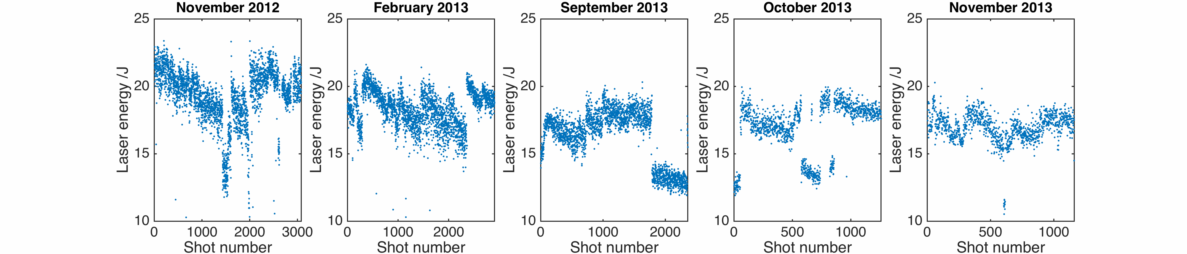
Sharp jumps in energy, especially between experiments, are probably due to a change in the energy measurement diagnostic. On the other hand, there are a few cases where the energy is on a downward trend during the experiment then suddenly jumps back up. This is due to application of some serious TLC by the Gemini laser staff, who must protect their laser from the hordes of visiting scientists trying to shoot it all day and night for weeks on end… It help to illustrate, however, that modern high power laser systems need a bit of love and attention to operate at their best – they are often working near the limits of their damage threshold/pump laser output/amplifier heat load etc.
Comments
Finally, I also have the manually-entered comments for every shot. Compiled together they comprise of 142,000 characters, or several tens of thousands of words – a solid fraction of a PhD thesis in themselves. Many of them, especially in the early hours of the morning, may make little sense on their own, so I have created a word cloud using the excellent word-cloud python module here.
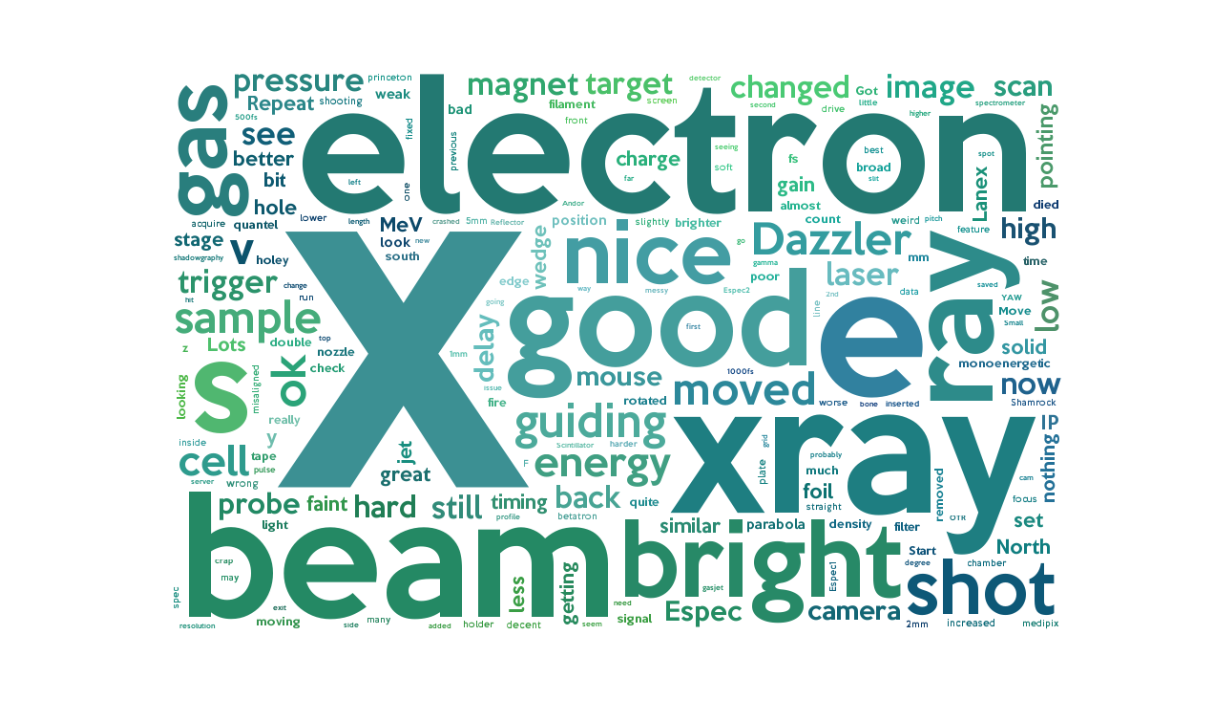
I must say, looking back at the highs and lows of 23 weeks of experimental time, I am pleased with the remarkably positive impression of this cloud. As expected for these experiments, ‘electron’ and ‘beam’ are prominent words, as are ‘x’ and ‘xray’ – also produced by the laser. ‘Dazzler’ refers to a commercial piece of equipment for changing the spectral properties of a laser pulse, rather than a colloquialism for a nice result. ‘Gas’ and ‘sample’ refer to our gas plasma targets and imaging targets respectively. ‘North’ and ‘South’ refer to the two beams of Gemini, ‘Lanex’ and ‘Espec’ refer to our electron spectrometer. Anyone involved in this type of experiment will surely pick out their own favourites above. Profanity waxes and wanes with the progress of the experiment, but I’m pleased to say it seems mostly absent here – we must have been biased towards recording particularly good shots rather than bad ones.
