I recently got a new phone, and have read online that its camera performance leaves much to be desired. As I bristle at the suggestion I could make a poor purchasing decision, let’s put this to the test. With maths!
The new phone in question is the OnePlus 7 Pro – it’s great! I haven’t had much chance to take photos of anything other than my cat recently, so haven’t really stressed the camera. Below, I’ll test the 4 modes over 3 lenses – regular (12 megapixel binned), full (48 megapixel), wide angle, and zoom. Additionally I’ve got my old, cracked OnePlus 5T to compare against.
Mathematical Background
When a camera forms an image, the imaging process is to take a perfect 2D snapshot of the world and corrupt it in various ways. Calculating and removing this correction factor is a complicated process, achieved either with better hardware (bigger, fancier lenses, larger, more sensitive CCDs etc), or increasingly in software (e.g. see any recent Pixel phone). The algorithmic and mathematical challenges are pretty complicated, e.g. see some of my previous posts.
To give a concrete example, lets focus here on resolution. Due to the finite size of the lens, any image has a finitely-sized resolution beyond which spatial details are blurred out. Mathematically, this process is a convolution, e.g. if 

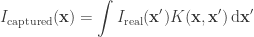
The term 

and so we would have
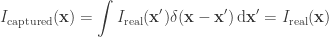
The larger the kernel therefore, the blurrier the image. Theoretically, one can show that a perfect lens would have a kernel given by the Airy function. In imaging, the kernel is also known as the point-spread function (PSF).
Let’s work out the details for a simple image, of a 1D sinusoidal pattern
imaged by a lens with spatial resolution 

(an Airy function can be approximated by a Gaussian if you don’t care about the details, like me.)
Now a useful theorem states that in Fourier space, the convolution of two functions is just represented by their products. This is useful, as calculating convolutions is difficult, but multiplying is simple. Given that

then
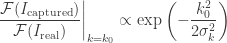
i.e. the effect of the finite image resolution is to reduce the amplitude of the image in Fourier space. If, therefore, we were to vary 

The images
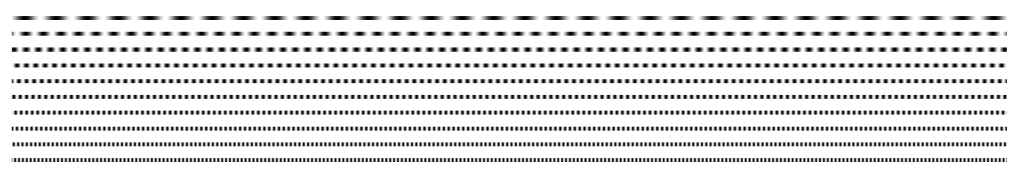
First things first, I need some images which consist of nothing but a clear spatial frequency in one direction. The following strips have frequencies increasing linearly from 1 to 8 units. (In this case, a frequency of ‘1’ meant a wavelength of 41 mm on my computer screen.)
I then took photos of this test pattern from a couple of metres away with the following lenses:
- OnePlus 5T
- OnePlus 7 Pro – standard 12MP
- OnePlus 7 Pro – zoom
- OnePlus 7 Pro – wide
- OnePlus 7 Pro – standard 48MP
The results, zoomed and cropped to the same sizes, look like this:
The immediate impression is that the 5T is significantly sharper than the 7 Pro at default settings. The big question I had was whether or not this was due to the imaging hardware, or software.
Analysis
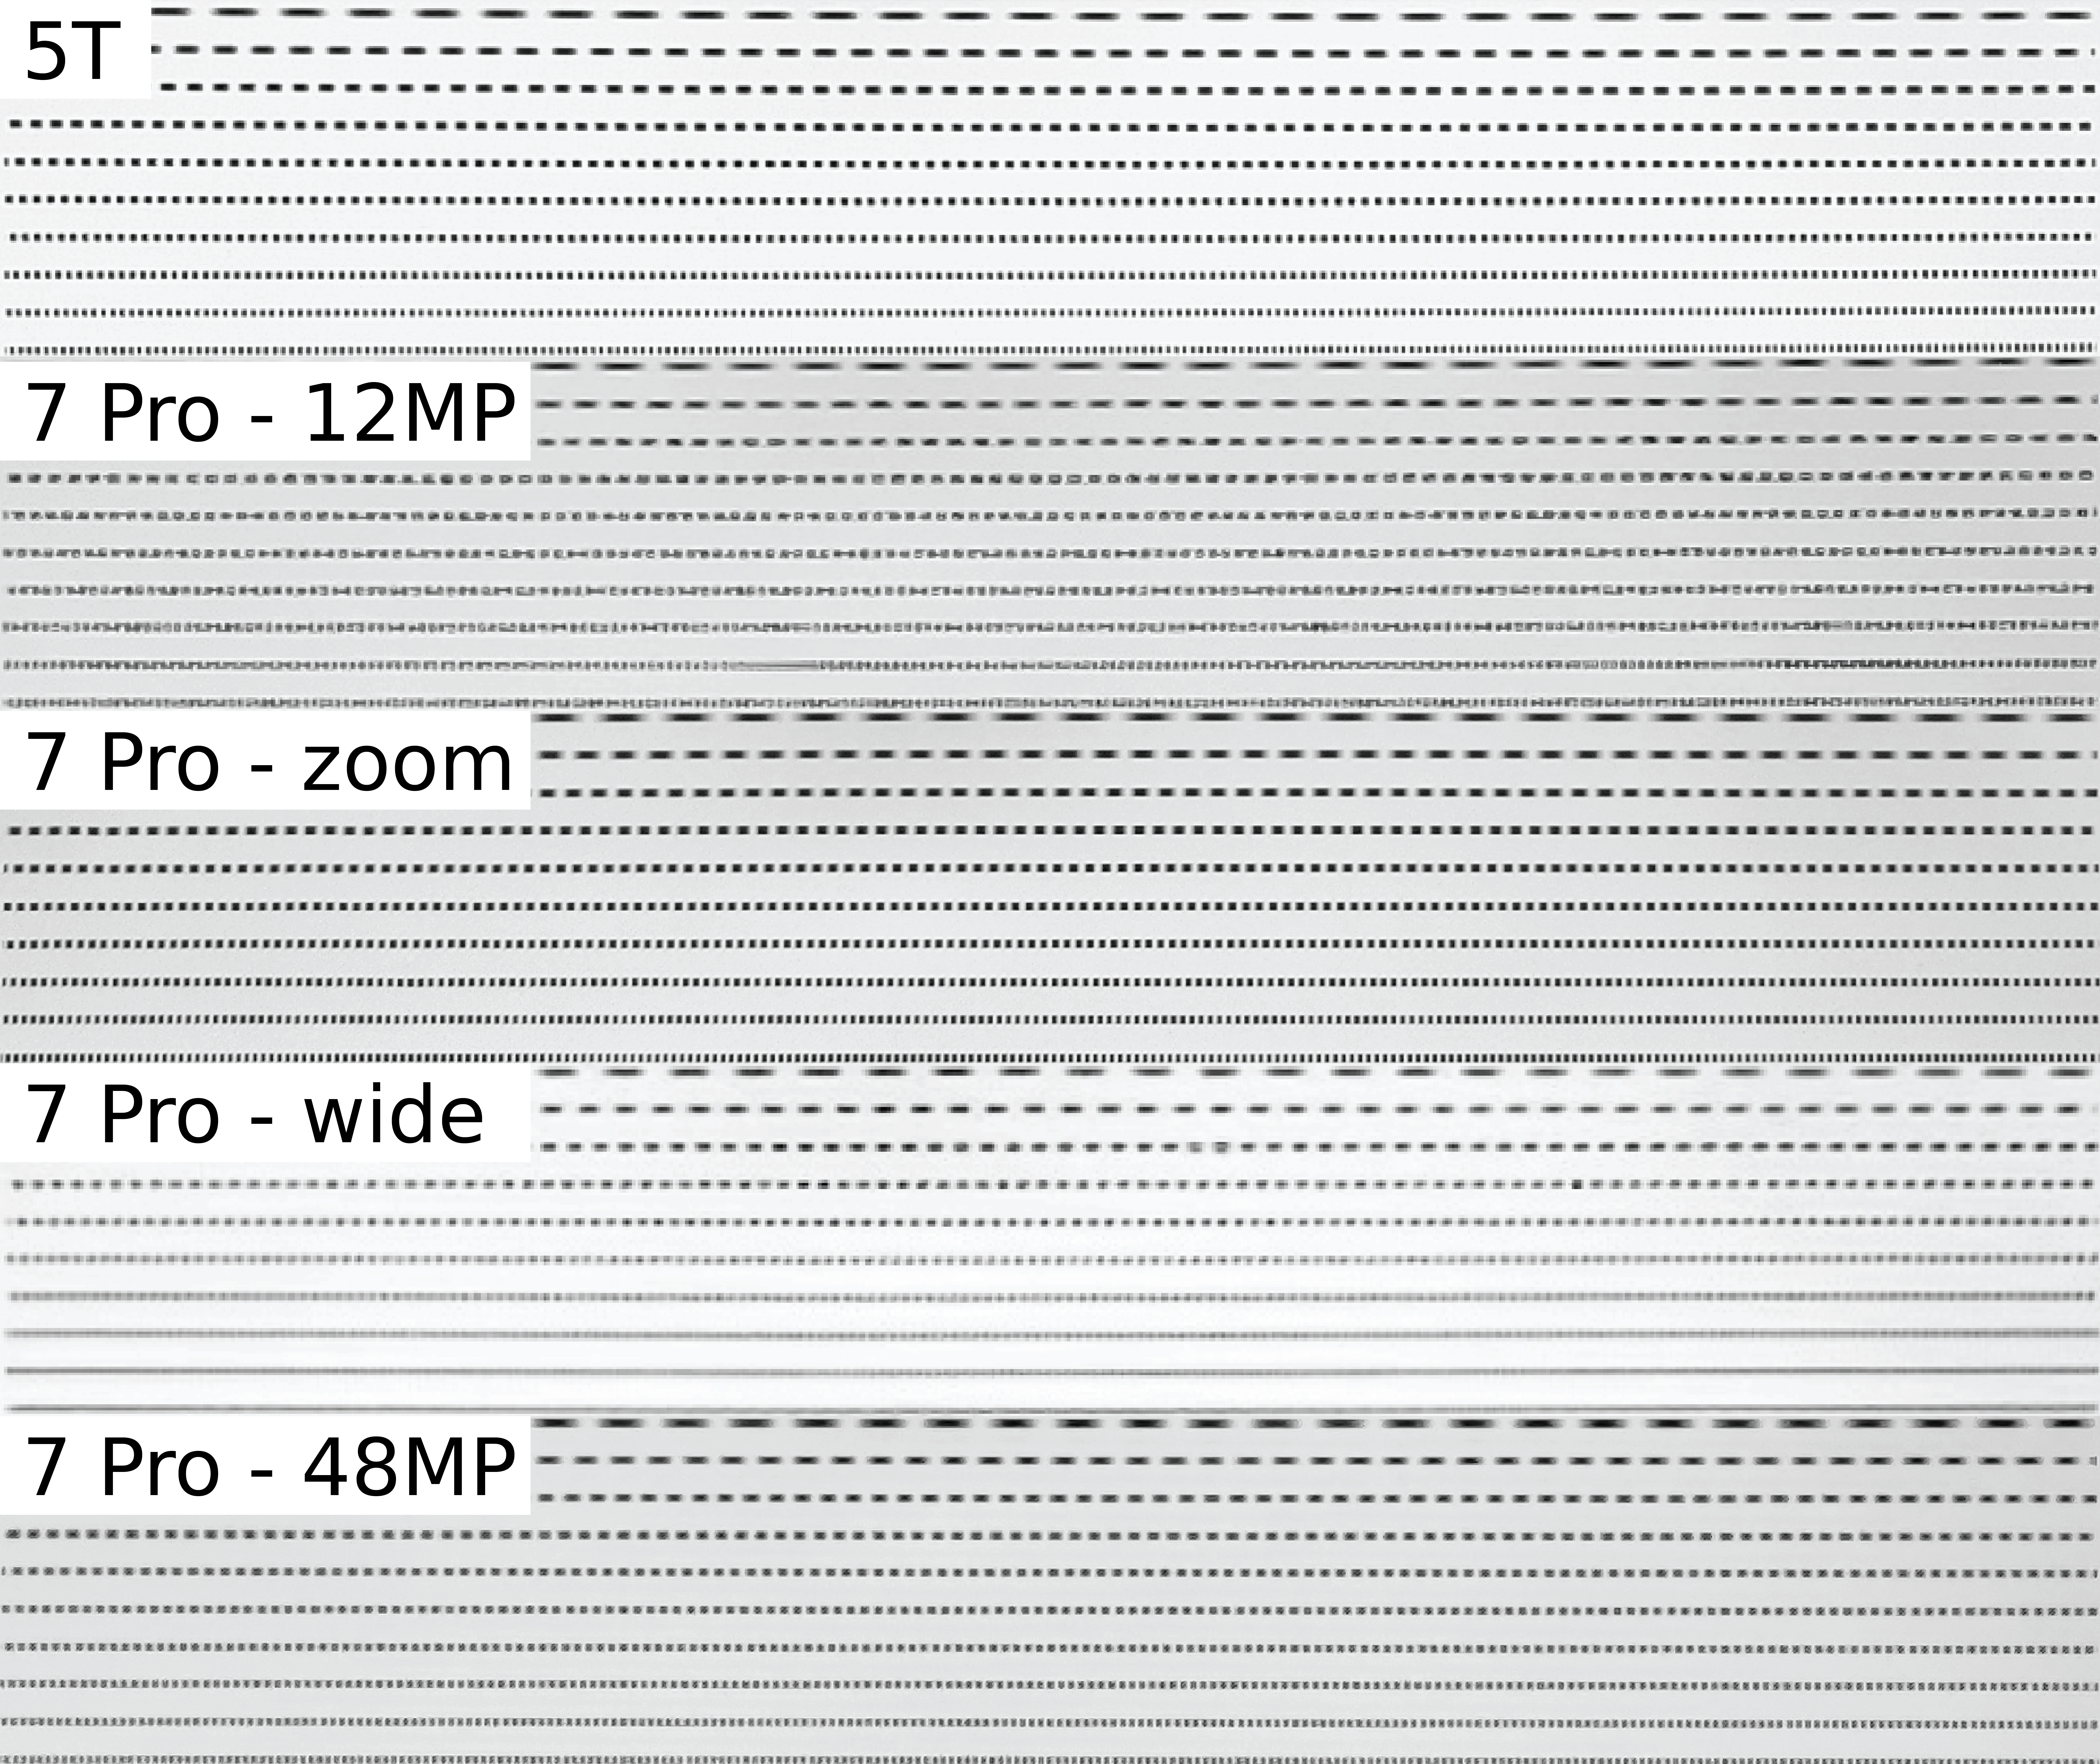
The first step is to take each of the rows in the test pattern, and take the Fourier transform. A single pixel row from the top pattern for the OnePlus 7 Pro – 12MP looks like this:
It’s not a perfect sinusoid, but it’ll do for our purposes. The Fourier transform then looks like:

As expected, there is a dominant peak around the fundamental frequency of the image, but also a significant second harmonic. This is likely due to edge-enhancement tweaks in the phone software, which we’ll come back to later.
Finding these peaks for all 10 frequencies then, we get the following:
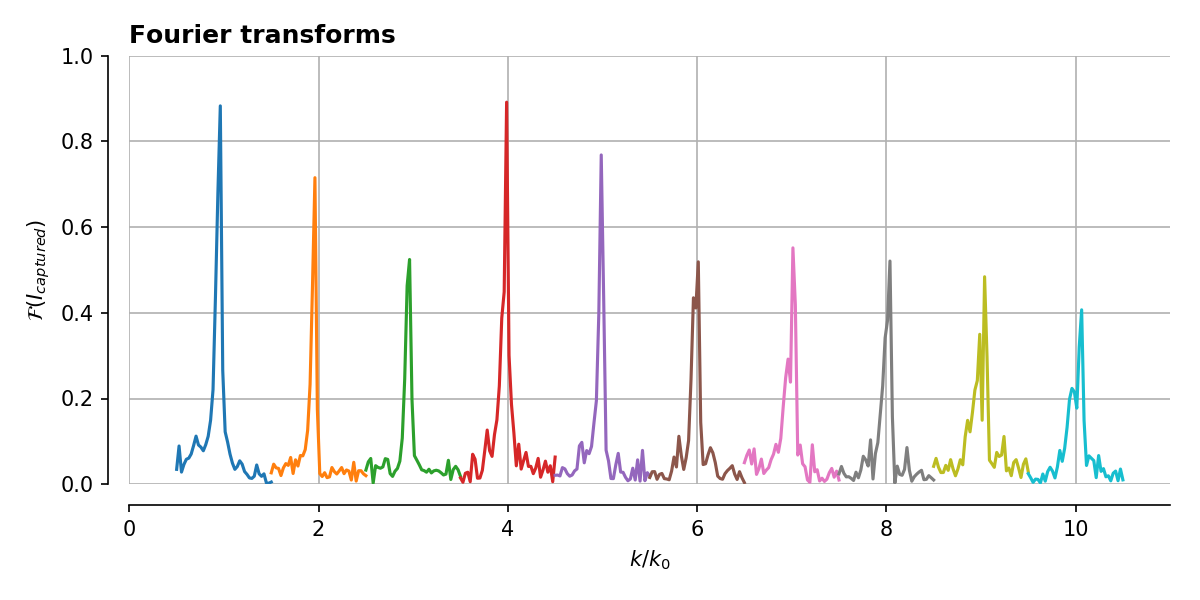
It’s not the least noisy data I’ve ever seen, but at least it’s possible to see a gradual decrease on average at high frequencies.
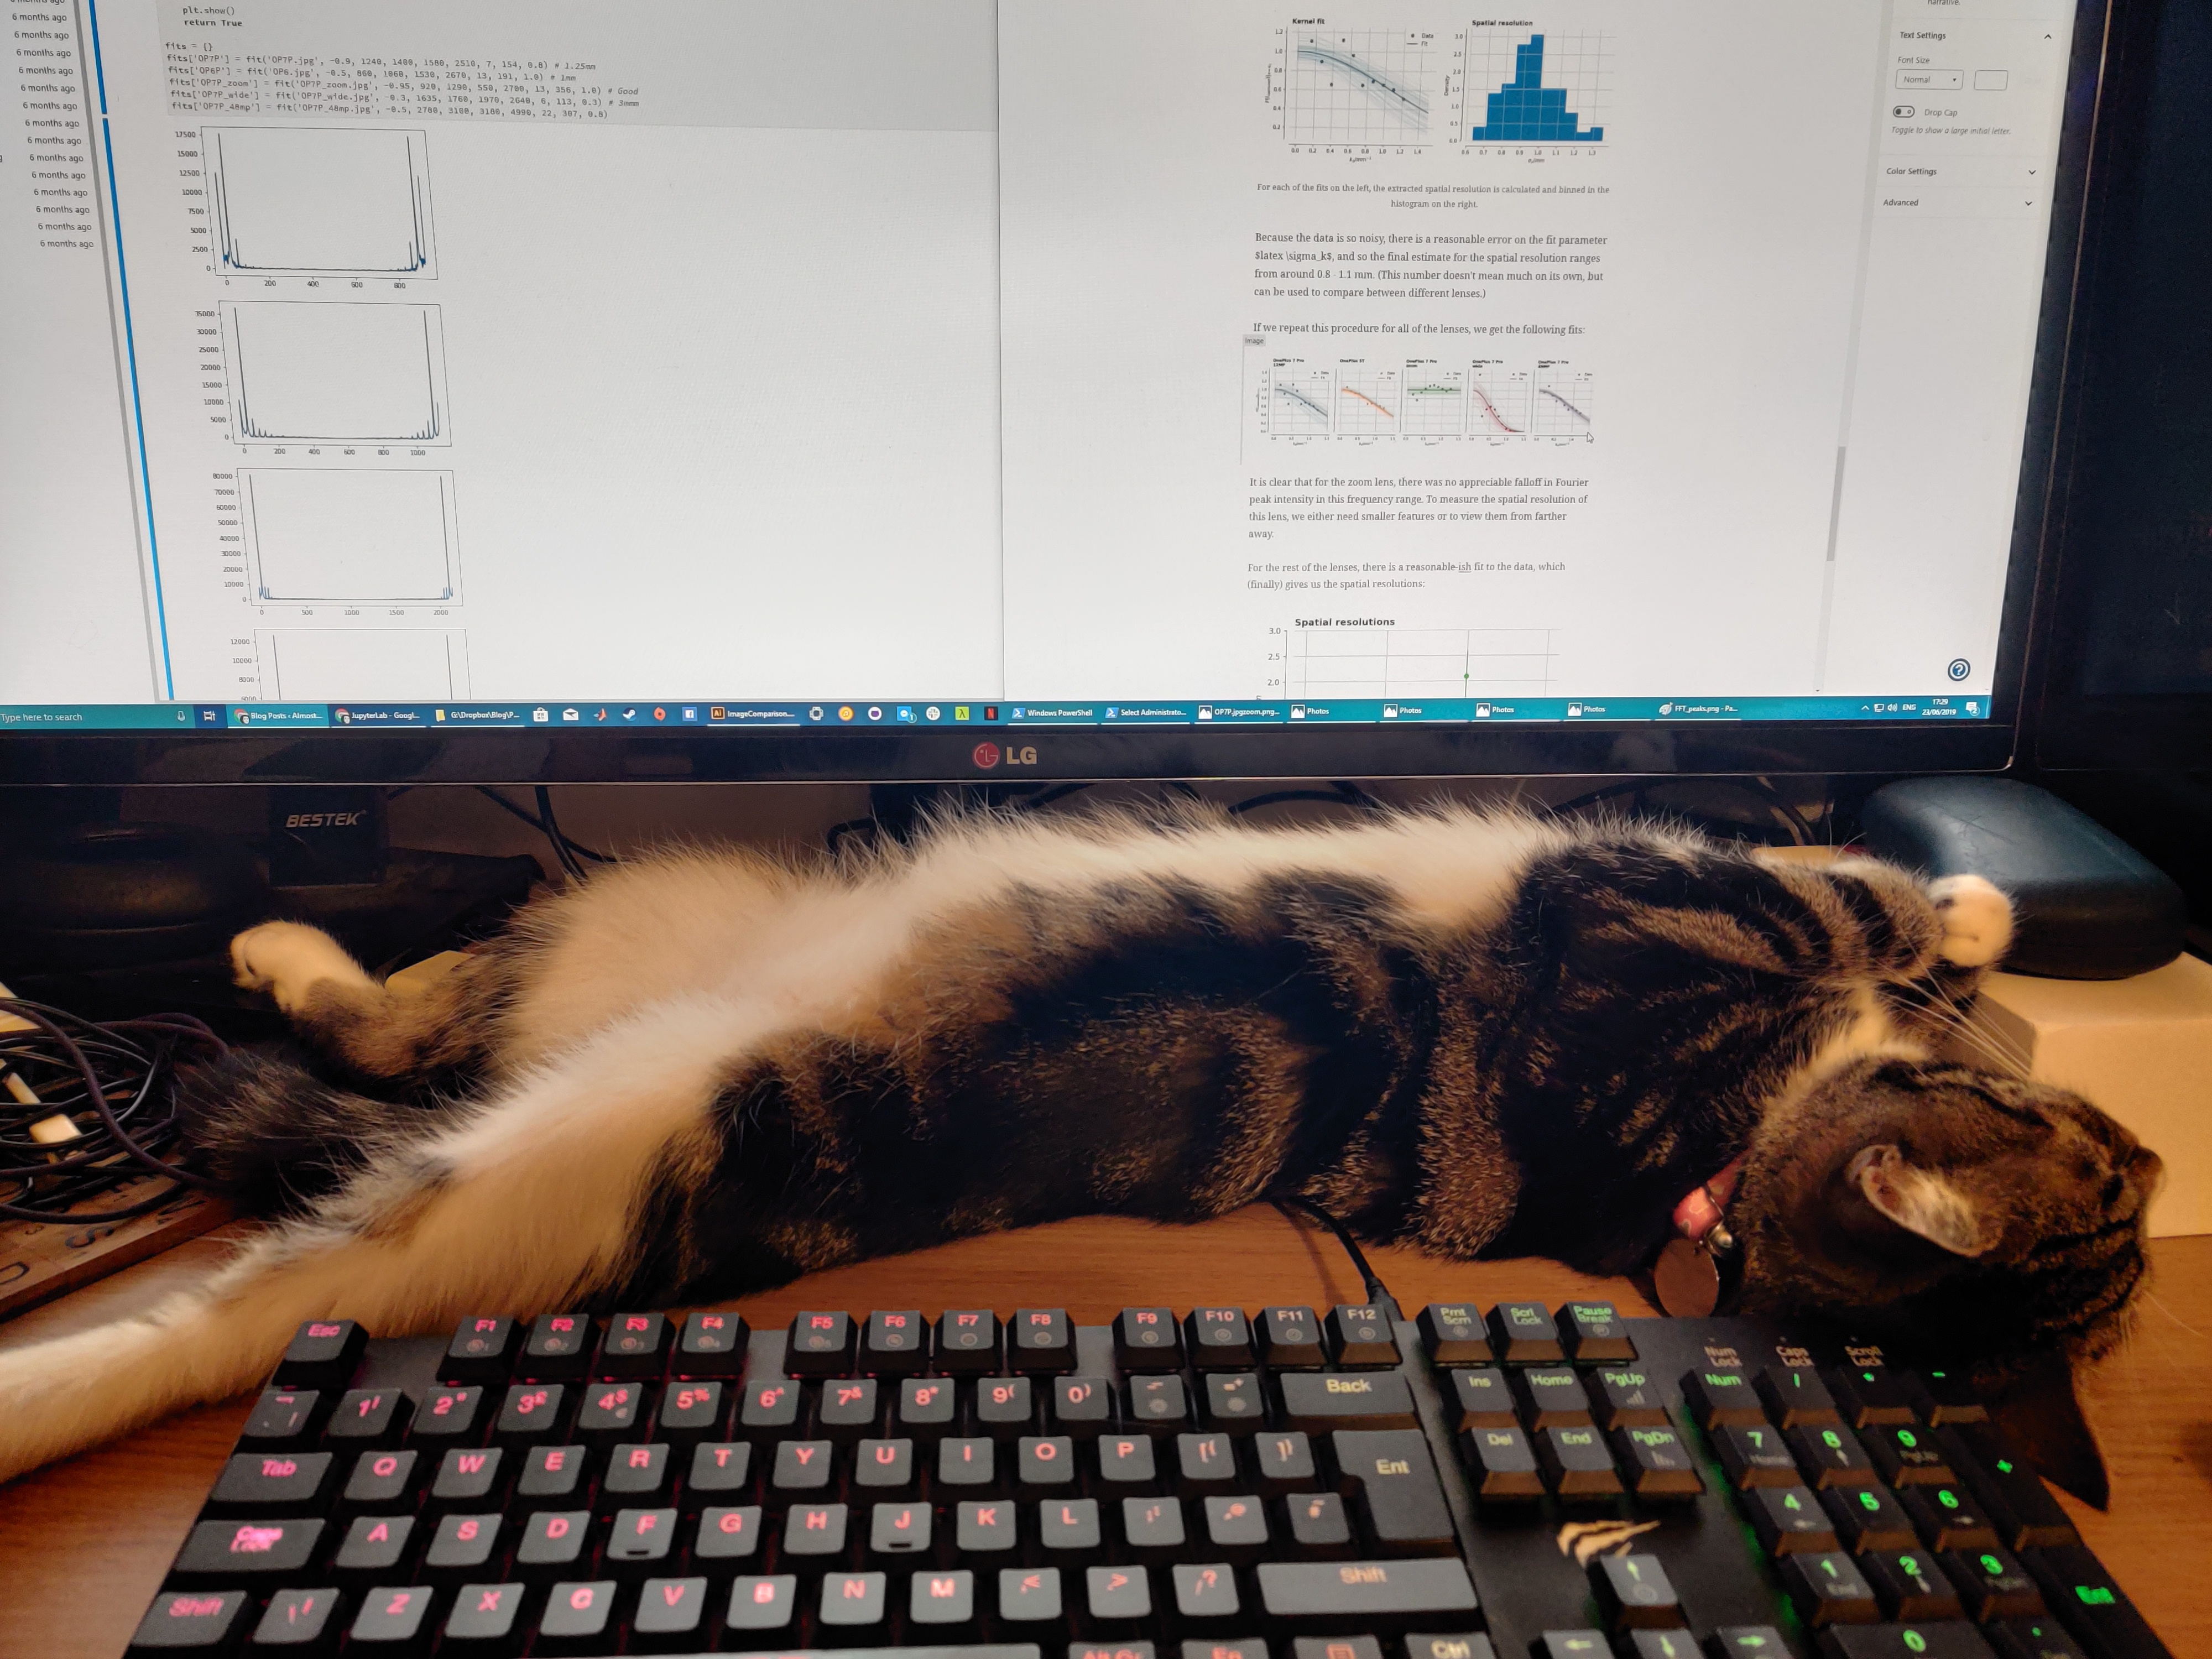
Doing the gaussian fit to the peak heights then, we get the following:
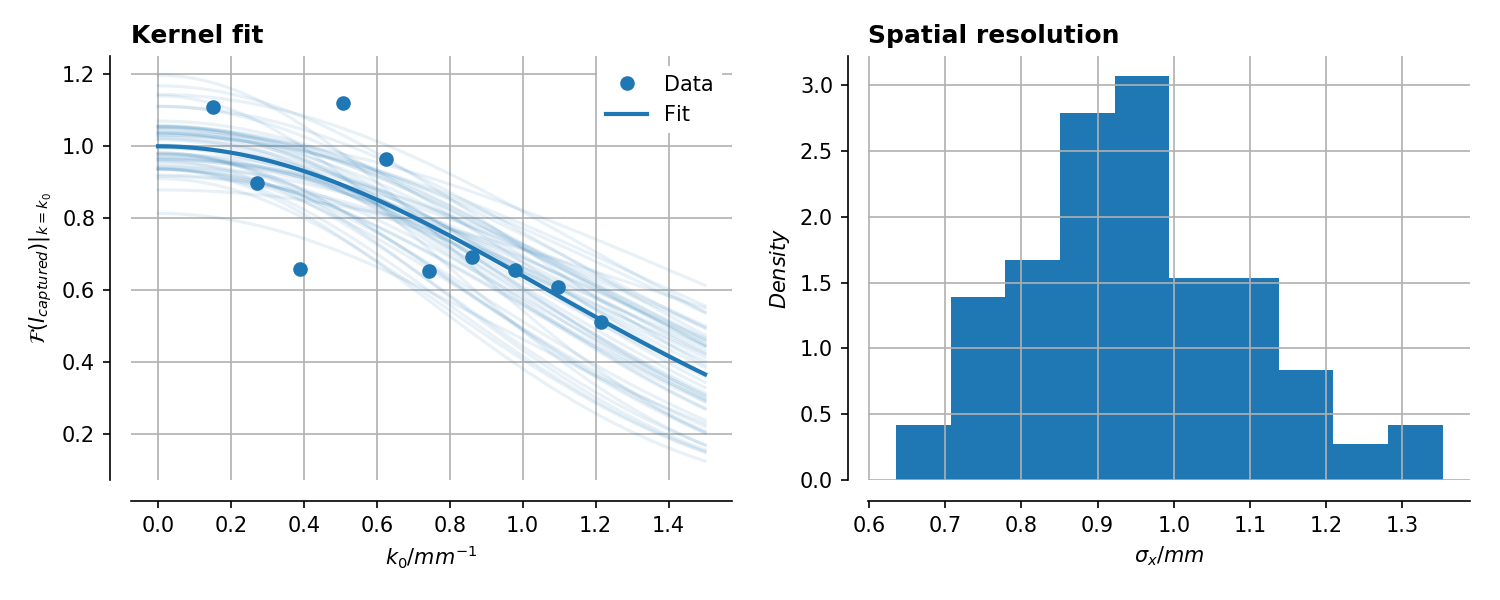
Because the data is so noisy, there is a reasonable error on the fit parameter
If we repeat this procedure for all of the lenses, we get the following fits:

It is clear that for the zoom lens, there was no appreciable falloff in Fourier peak intensity in this frequency range. To measure the spatial resolution of this lens, we either need smaller features or to view them from farther away.
For the rest of the lenses, there is a reasonable-ish fit to the data, which (finally) gives us the spatial resolutions:
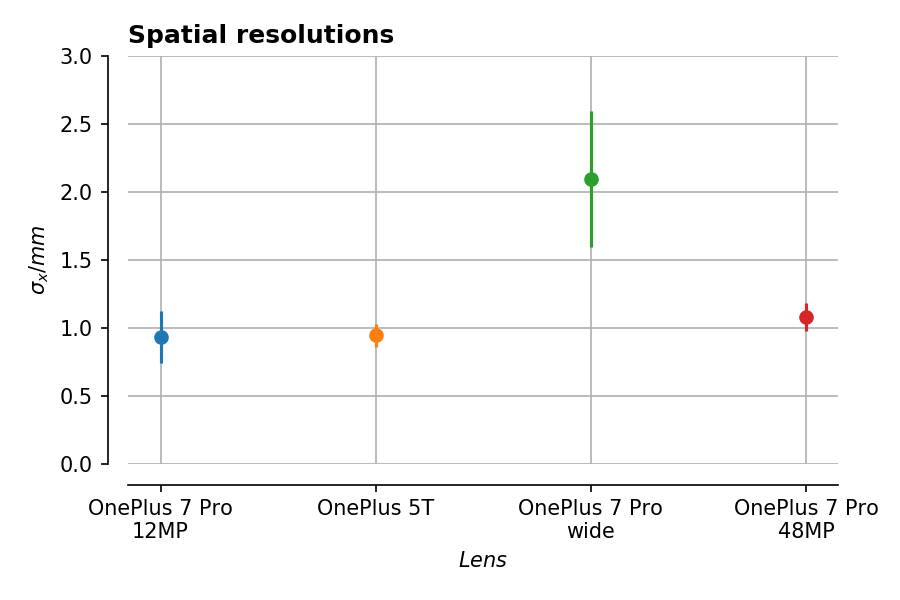
This is pretty interesting – between the 5T and the main lens on the 7 Pro, there isn’t a big difference in apparent spatial resolution. The wide-angle lens is definitely worse in this respect, but then its field of view is larger so that makes sense.
Given the images above though, it’s surprising that the default mode of the 7 Pro is so similar to the rest, when I would have expected it to be lower. One possibility is that the lens itself is fine, as evidenced by the 48MP images, but that the software sharpening has gone a bit mad. This makes the fine features in the test pattern look bad, but actually the features are still there, just hidden under some sharpening noise.
Maths and data aside, one definite conclusion which can be made is that synthetic benchmarks like this are great in theory, but you should actually look at the photos before deciding anything! In this case the benchmarks show the resolution hasn’t regressed, but the raw image quality seems to have done. If and when I receive any updates to the camera software, I’ll be sure to revisit this analysis in the future.
